When did things
start going wrong in the UK? Many
would give the Global Financial Crisis (GFC) as the
answer. Now that may be a good answer for some reasons (see below),
but I want to suggest one reason that is perhaps not so good as it
first appears. That reason is labour productivity, growth and living
standards.
Why does it appear
to be the answer for UK productivity and growth? Here I can just
refer to the chart that is at the
top of my post two weeks ago, showing UK GDP per head
before and after the GFC. As I have noted many times, underlying
growth in UK GDP per head (and therefore to a first approximation
real earnings) before the GFC is remarkably consistent, with a trend
growth rate since the 1950s of just over 2%. There are of course
booms and recessions around that trend, but until 2007 every economic
downturn seemed to be followed by a recovery that put the level of
GDP per head back on its trend line. Of course that constancy from
the 1950s until the 2000s could well be a coincidence, with different
factors influencing productivity more than others over particular
parts of those fifty odd years.
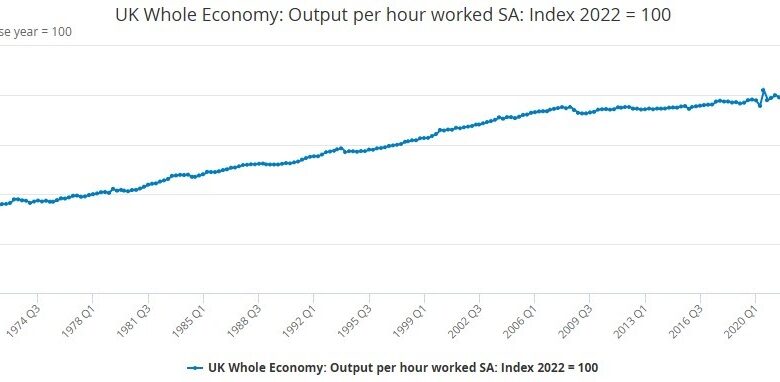
Below is UK output
per hour worked, which shows the same pattern (source)

After the recession
of 2008/9 there was almost no recovery in the sense of output or
productivity growing faster than trend. So the level of productivity
and GDP per head did not return to its previous trend line. In
addition, the growth rate also slowed substantially, to something
like half the previous trend. It therefore looks like something
disastrous happened around 2007, and the Global Financial Crisis is
the obvious culprit.
Now we all know that
the GFC started in the United States, and that the US financial
system was also very badly hit by that crisis. Below is a picture of
US productivity growth (output per hour in the non-farm economy).

It is a more complex
picture than for the UK, but growth after 2007 does not look that
different from growth since the 1970s, with the exception of a period
of more rapid expansion from the mid-1990s to the mid 2000s. That
period of more rapid growth is generally put down to the impact of
the IT revolution. Here are some average annual growth rates:
Year on year productivity growth in the
US (defn and source as previous chart)
|
|
|
|
|
|
|
|
|
|
|
|
|
|
|
|
|
|
If we put the rapid
growth around the millennium down to the IT revolution, then there is
no downward shift in either the level or the growth rate of
productivity as a result of the GFC.
Now it is of course
possible that the GFC had a much more profound impact on UK growth
than in the US. But there is an additional empirical reason to doubt
that the GFC was the obvious reason why UK productivity growth
declined so drastically. Below is a chart of productivity in the UK
financial sector [1].

Financial services
productivity started growing rapidly around 2004/5. We now know this
was unsustainable, because it was based on levels of leverage that
meant the sector could not survive significant negative shocks. If we
take financial services out of the UK aggregate, then it becomes
apparent that productivity growth in the rest of the economy began to
slow from the post-war trend a few years before 2007. In addition the
growth rate in the early 2010s is a bit better than the aggregate
figures suggest.
It was for this
reason that in this previous post I was careful to talk about a
productivity slowdown, in the UK and elsewhere, that happened around
2005, rather than after the GFC. Why does a difference of a few years
matter? As the reason for the decline in UK productivity relative to
other advanced economies remains something of a puzzle, associating
it with the GFC naturally focuses attention on financial factors to explain that puzzle. Placing the decline starting
around 2005 allows for a wider range of possibilities.
In particular, it
ties UK productivity trends more closely to those in the US. Perhaps
UK productivity growth also benefited from the IT revolution around
the millennium, and so at least part of the absolute decline in UK’s
productivity growth since around 2005 is a result of that revolution
petering out, just as we saw in the US. Doing this allows us to be far more eclectic about when
underlying UK productivity started growing less than other major
economies like the US. Excluding finance, UK productivity growth was
quite strong after the recession, and it is only around 2013 that
growth rates seem to clearly shift to below US levels. Of course none
of this rules the GFC out as a key factor in explaining the UK
productivity puzzle, but it does remove the GFC as the empirically
compelling cause.
Are there other
reasons besides growth for suggesting the GFC was the beginning of
the UK’s recent relative decline? The obvious answer is that the
deep recession it caused was key in ending the Labour government, and
therefore starting a period of Conservative government that has been
economically disastrous. However even this could be contested. Gordon
Brown became pretty unpopular as Prime Minister well before the
recession hit, and some would argue his standing as PM rose as a
result of his handling of the GFC.
It is also crucial
not to get the impact of the GFC crisis confused with the policy
response to it, which was general fiscal consolidation, aka
austerity. The long period of ultra low interest rates that began
during the GFC but lasted for the next decade, and which helped
create a boom in asset prices including house prices, was not a
result of the GFC but was instead due to fiscal austerity. If the
2010 Coalition government, and governments around the world, had
responded to the GFC recession by continuing rather than reversing
fiscal expansion, as financial markets were crying out for them to do
(because all interest rates were so low), then the
period of ultra low rates would have ended in the early 2010s,
and we would not have seen such a marked increase in asset prices.
[1] Levels
extrapolated from growth rates, source.
Source link